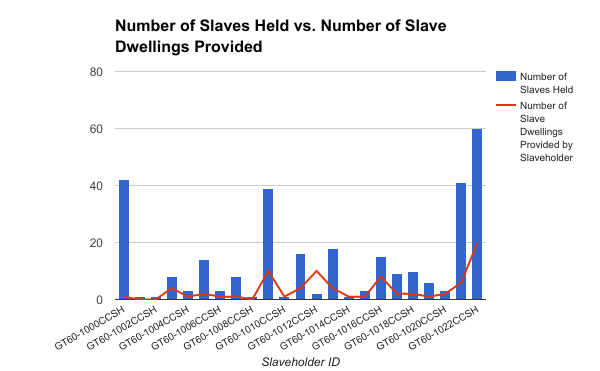
Figure 7: Most of Gooding’s bondspeople were provided their own dwellings in 1860. These dwellings were often multi-family, but separate from that of their owner. Even smaller slaveholders provided separate dwellings for their bondspeople. This disputes much of what historians have assumed about slave dwellings in antebellum Craven County, and calls into question the narrative of proximity-based familial-style relationships between enslaved people and their owners. Going forward, it might be interesting to see how the number of slave dwellings provided changed according to the number of enslaved people on a given plantation. From the initial data, it appears that the average number of bondspeople per dwelling was 4.7. This number may have varied according to whether or not some enslaved people resided in their master’s houses, while others had their own quarters.
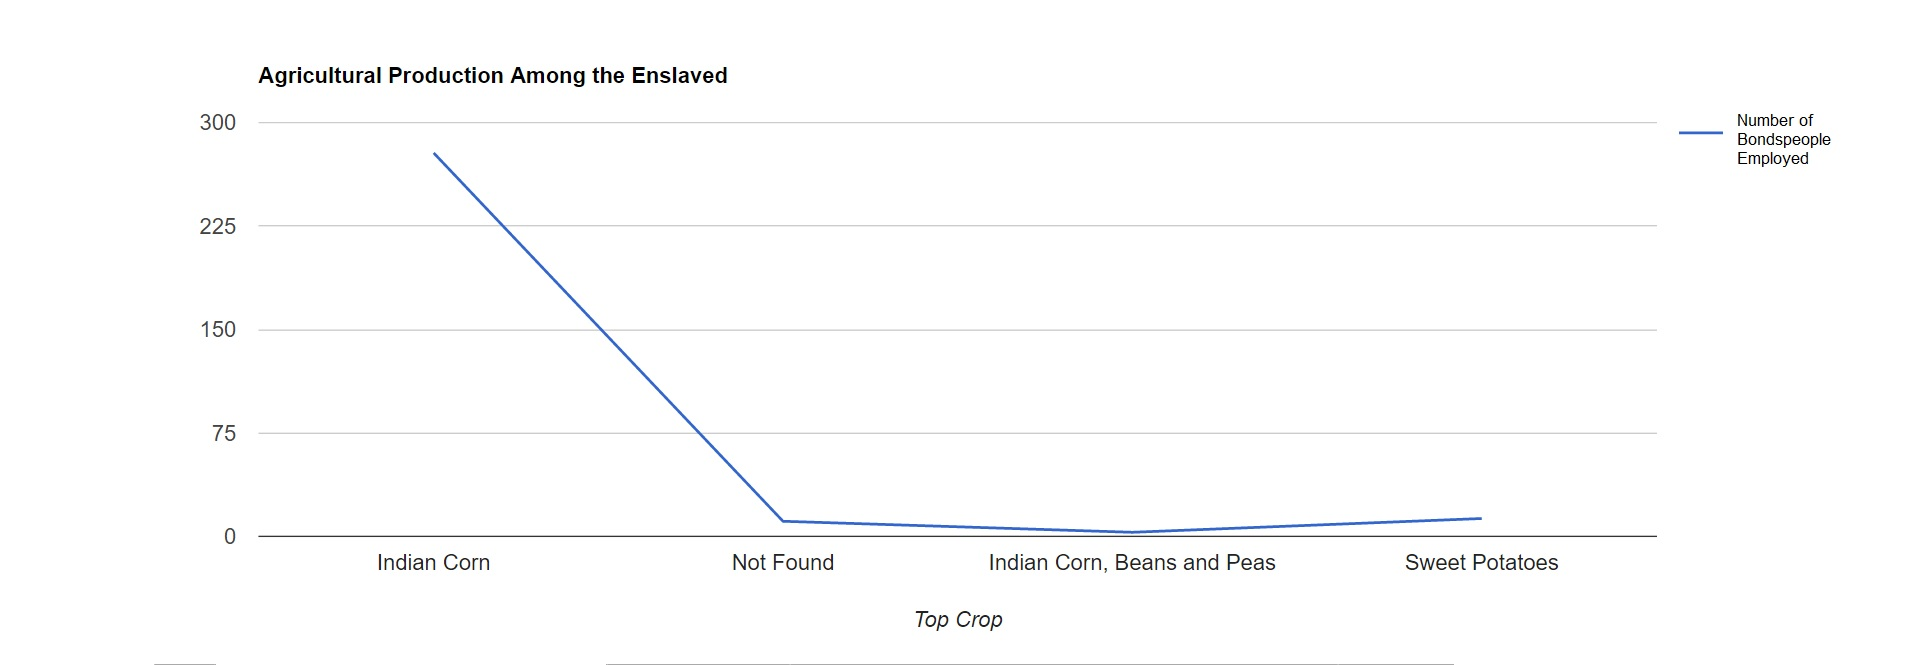
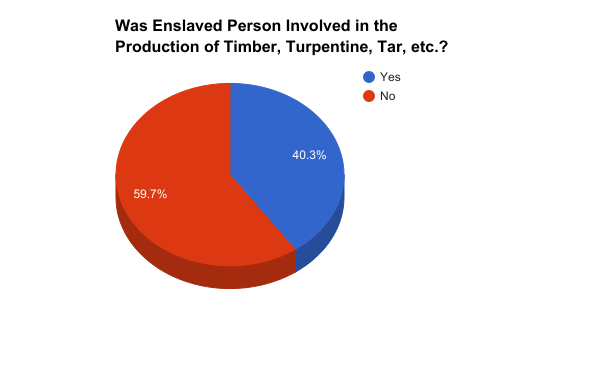
Figures 8-9:The overwhelming majority of the enslaved people living and working in Goodings in 1860 were engaged in corn-based agriculture. While many of their owners were involved in the production of turpentine and naval stores (tar, timber, etc.), nearly 60% were not. This matches what we know from the narrative of enslaved life in Craven County, which states that tobacco, cotton, and other antebellum southern staples were not grown in North Carolina to the extent that they were in neighboring states (“North Carolina and Tobacco”). Indeed, only nine slaves-all owned by Clifford Simpson (GT60-1017CCSH)-were involved in raising such crops. In their case, it was rice, rather than tobacco or cotton-an unexpected departure considering the geographical area. These same bondspeople were also the only ones involved in the production of sweet potatoes as their main crop.